Search for Indicators
Suicide Prevention
Suicide is a leading cause of death in the United States, presenting a major, preventable public health problem. More than 33,000 people kill themselves each year according to the Centers for Disease Control and Prevention, but suicide deaths only account for part of the problem. An estimated 25 attempted suicides occur per every suicide death, and those who survive suicide may have serious injuries, in addition to having depression and other mental problems. Other repercussions of suicide include the combined medical and lost work costs on the community, totaling to over $30 billion for all suicides in a year, and the emotional toll on family and friends. Men are about four times more likely than women to die of suicide, but three times more women than men report attempting suicide. Suicide occurs at a disproportionately higher rate among adults 75 years and older. If you or someone you know is in crisis, please contact the Suicide & Crisis Lifeline at 988 or 988lifeline.org.
Indicator Gauge Icon Legend
Legend Colors
Red is bad, green is good, blue is not statistically different/neutral.
Compared to Distribution
 the value is in the best half of communities.
 the value is in the 2nd worst quarter of communities.
 the value is in the worst quarter of communities.
Compared to Target
 meets target;
  does not meet target.
Compared to a Single Value
 lower than the comparison value;
 higher than the comparison value;
 not statistically different from comparison value.
Trend

 non-significant change over time;
 significant change over time;
  no change over time.
Compared to Prior Value
 higher than the previous measurement period;
 lower than the previous measurement period;
 no statistically different change from previous measurement period.
 Significantly better than the overall value
 Significantly worse than the overall value
 Significantly different than the overall value
 No significant difference with the overall value
 No data on significance available
Health / Adolescent Health
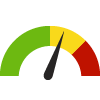
11th Graders Who Reported Considering Suicide County: Humboldt
11th Graders Who Reported Considering Suicide County: Humboldt
22.0%
(2021-2023)
Compared to:


CA Value
(16% in 2019-2021)
The regional value is compared to the California state value.
Prior Value
(17.0%)
Prior Value compares a measured value with the previously measured value. Confidence intervals were not taken into account in determining the direction of the comparison.
Trend
This comparison measures the indicator’s values over multiple time periods.<br>The Mann-Kendall Test for Statistical Significance is used to evaluate the trend<br>over 4 to 10 periods of measure, subject to data availability and comparability.
Health / Adolescent Health
11th Grade Nontraditional Students Considering Suicide in Past 12 Months
Value
Compared to:
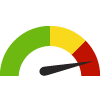
11th Grade Nontraditional Students Considering Suicide in Past 12 Months County: Humboldt
11th Grade Nontraditional Students Considering Suicide in Past 12 Months County: Humboldt
30.0
25
(2019-2021)
Compared to:
Humboldt, CA County Value
(14)
The regional value is compared to the California state value.
Prior Value
(25.0)
Prior Value compares a measured value with the previously measured value. Confidence intervals were not taken into account in determining the direction of the comparison.
Trend
This comparison measures the indicator’s values over multiple time periods.<br>The Mann-Kendall Test for Statistical Significance is used to evaluate the trend<br>over 4 to 10 periods of measure, subject to data availability and comparability.
Health / Adolescent Health
11th Graders Who Reported Feeling Sadness/Hopelessness
Value
Compared to:
11th Graders Who Reported Feeling Sadness/Hopelessness County: Humboldt
11th Graders Who Reported Feeling Sadness/Hopelessness County: Humboldt
44.0%
(2021-2023)
Compared to:

CA Value
(42% in 2019-2021)
The regional value is compared to the California state value.
Prior Value
(42.0%)
Prior Value compares a measured value with the previously measured value. Confidence intervals were not taken into account in determining the direction of the comparison.
Trend
This comparison measures the indicator’s values over multiple time periods.<br>The Mann-Kendall Test for Statistical Significance is used to evaluate the trend<br>over 4 to 10 periods of measure, subject to data availability and comparability.
Health / Adolescent Health
11th Grade Students in Nontraditional Schools Reporting Sadness
Value
Compared to:
11th Grade Students in Nontraditional Schools Reporting Sadness County: Humboldt
11th Grade Students in Nontraditional Schools Reporting Sadness County: Humboldt
45.0%
(2021-2023)
Compared to:
CA Value
(38% in 2019-2021)
The regional value is compared to the California state value.
Prior Value
(50.0%)
Prior Value compares a measured value with the previously measured value. Confidence intervals were not taken into account in determining the direction of the comparison.
Trend
This comparison measures the indicator’s values over multiple time periods.<br>The Mann-Kendall Test for Statistical Significance is used to evaluate the trend<br>over 4 to 10 periods of measure, subject to data availability and comparability.
Health / Mental Health & Mental Disorders
Age-Adjusted Death Rate due to Suicide County: Humboldt
Age-Adjusted Death Rate due to Suicide County: Humboldt
22.8
Deaths per 100,000 population
(2020-2022)
Compared to:
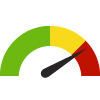
CA Counties
The distribution is based on data from 57 California counties.
CA Value
(10.1)
The regional value is compared to the California state value.
US Value
(13.5 in 2020)
The regional value is compared to the national value. The source for the national value is Centers for Disease Control and Prevention
Prior Value
(20.3)
Prior Value compares a measured value with the previously measured value. Confidence intervals were taken into account in determining the direction of the comparison.
Trend
This comparison measures the indicator’s values over multiple time periods.<br>The Mann-Kendall Test for Statistical Significance is used to evaluate the trend<br>over 4 to 10 periods of measure, subject to data availability and comparability.
HP 2030 Target
(12.8)
<div>MHMD-01: Reduce the suicide rate <strong>(LEADING HEALTH INDICATOR)</strong></div>
Health / Mental Health & Mental Disorders
Adults Who Ever Thought Seriously About Suicide
Value
Compared to:
Adults Who Ever Thought Seriously About Suicide County: Humboldt
Adults Who Ever Thought Seriously About Suicide County: Humboldt
35.2%
(2021-2022)
Compared to:
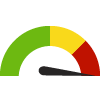
CA Counties
The distribution is based on data from 58 California counties.
CA Value
(19.0%)
The regional value is compared to the California state value.
Prior Value
(31.9%)
Prior Value compares a measured value with the previously measured value. Confidence intervals were taken into account in determining the direction of the comparison.
Trend
This comparison measures the indicator’s values over multiple time periods.<br>The Mann-Kendall Test for Statistical Significance is used to evaluate the trend<br>over 4 to 10 periods of measure, subject to data availability and comparability.
Health / Mental Health & Mental Disorders
Emergency Department Visits due to Non-fatal Self-inflicted Injury
Value
Compared to:
Emergency Department Visits due to Non-fatal Self-inflicted Injury County: Humboldt
Emergency Department Visits due to Non-fatal Self-inflicted Injury County: Humboldt
159.2
Per 100,000 population
(2022)
Compared to:
Prior Value
(152.3)
Prior Value compares a measured value with the previously measured value. Confidence intervals were not taken into account in determining the direction of the comparison.
Trend
This comparison measures the indicator’s values over multiple time periods.<br>The Mann-Kendall Test for Statistical Significance is used to evaluate the trend<br>over 4 to 10 periods of measure, subject to data availability and comparability.
Health / Mental Health & Mental Disorders
7th Graders Considering Suicide in the Past 12 Months
Value
Compared to:
7th Graders Considering Suicide in the Past 12 Months County: Humboldt
7th Graders Considering Suicide in the Past 12 Months County: Humboldt
21.0%
(2021-2023)
Compared to:
Prior Value
(20.0%)
Prior Value compares a measured value with the previously measured value. Confidence intervals were not taken into account in determining the direction of the comparison.
Health / Mental Health & Mental Disorders
7th Graders Experiencing Chronic Sadness/Hopelessness Over the Past 12 Months
Value
Compared to:
7th Graders Experiencing Chronic Sadness/Hopelessness Over the Past 12 Months County: Humboldt
7th Graders Experiencing Chronic Sadness/Hopelessness Over the Past 12 Months County: Humboldt
37.0%
(2021-2023)
Compared to:
Prior Value
(39.0%)
Prior Value compares a measured value with the previously measured value. Confidence intervals were not taken into account in determining the direction of the comparison.
Trend
This comparison measures the indicator’s values over multiple time periods.<br>The Mann-Kendall Test for Statistical Significance is used to evaluate the trend<br>over 4 to 10 periods of measure, subject to data availability and comparability.
